REVENUE
20.8%% GDP
EXPENDITURE
23.0%% GDP
IN-DEBT
EDNESS
Has sido redireccionado a simuladorfiscal.ddns.net para tener una mejor visualización desde tu dispositivo iOS
REVENUE
EXPENDITURE
IN-DEBT-EDNESS
DEBT per capita 2023
DEBT per capita 2030
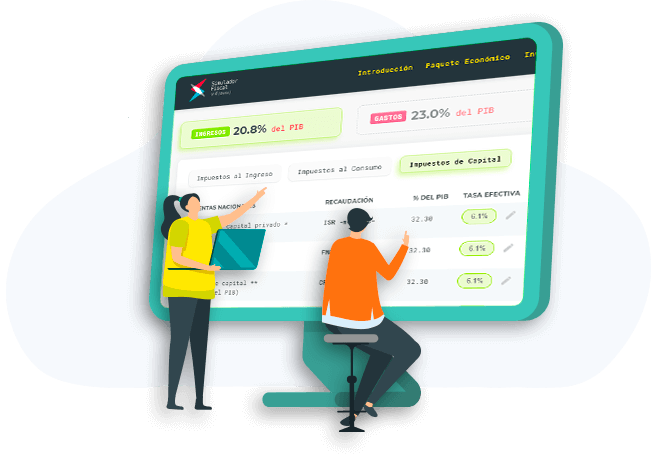
This is an interactive digital tool that allows you generate and model your own public policies and understand their effects on income redistribution and fiscal sustainability.
Default values are from 2023's Fiscal Budget!
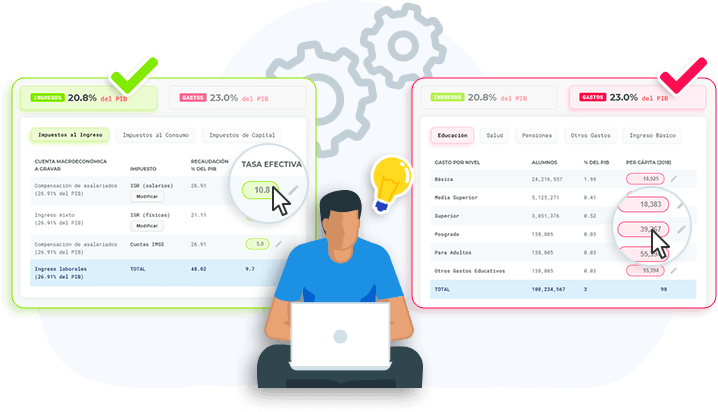
FOLLOW THESE 2 SIMPLE STEPS!
Change fiscal REVENUE and EXPENDITURE policies. Remember: you need a source of revenue for any expenditure.
When you’re ready, click Calculate results to find out what consequences your simulation would have on income redistribution and long-term fiscal sustainability.
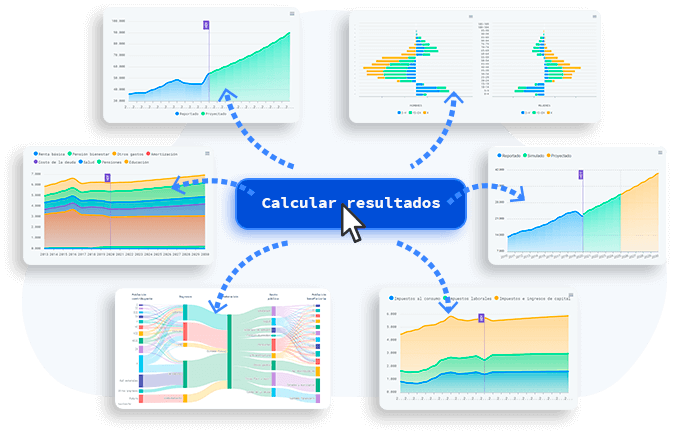
Review and reflect on your results. Would there be fair redistribution? Would it be sustainable? You decide!
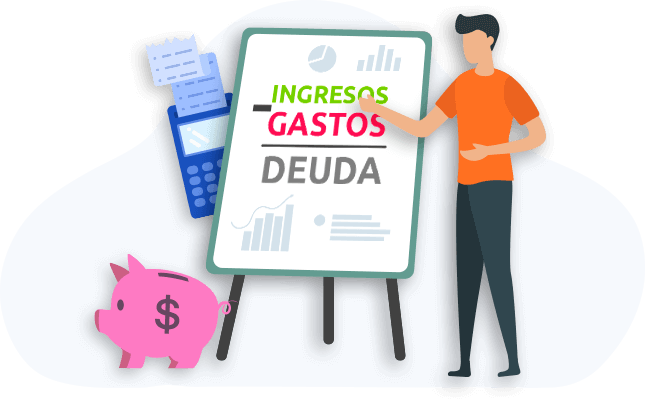
REVENUE
EXPENDITURE
IN-DEBT
EDNESS
©2023 | CIEP Fiscal Simulator
Source: Prepared with the CIEP Tax Simulator v5.
| Decile | Annual contribution by household (MXN 2023) |
Distribution (%) |
% of household annual income |
|---|---|---|---|
| I | -$9,000 | ||
| II | -$9,000 | ||
| III | -$9,000 | ||
| IV | -$9,000 | ||
| V | -$9,000 | ||
| VI | -$9,000 | ||
| VII | -$9,000 | ||
| VIII | -$9,000 | ||
| IX | -$9,000 | ||
| X | -$9,000 | ||
| Nacional | -$9,000 |
By adding all contributions paid and subtracting all public expenditure received, we obtain the net contributions in our simulation. The hope is for income redistribution to be progressive: those with the most should contribute the most, and those with the least should receive the most.
The first column indicates the household income decile. The second column is a household’s average yearly aggregate contribution. The third column shows how contributions are distributed across households. The fourth column calculates the contribution as a proportion of household income.
Source: Prepared with the CIEP Tax Simulator v5.
Firstly, the way people produce and consume changes at each stage of life. The young go to school or university, adults go to work, and older people start to retire. This pattern is similar all over the world.
Secondly, gender roles, wage differentials, and unequal opportunities between men and women also affects economic behavior and tax obligations. Here we summarize intra-household transfers (e.g. from parent to child, if they live together) and inter-household transfers (e.g. from grandparent to grandchild, if they do not live together).
Source: Prepared with the CIEP Tax Simulator v5.
Source: Prepared with the CIEP Tax Simulator v5.
Taxes on labor-based income and on consumption are influenced by the composition of the population and its productivity. Taxes and income from capital depend on economic activity.
With the effective rates modelled for the different components of GDP, demographic transition and economic growth, the amount of public resources available can be projected into the future. This amount should be sufficient to support government spending.
Source: Prepared with the CIEP Tax Simulator v5.
Source: Prepared with the CIEP Tax Simulator v5.
The long-term debt trend represents the government’s capacity to meet its obligations given its capacity to raise revenue. A stable, or ideally downward, trend is desired.
An increasing debt can mean generational inequity: spending future resources that have not yet been generated. Unsustainability would mean passing on the burden of debt to future generations, who may not benefit from it.
Una tendencia "deseable" sería aquella donde la deuda se mantendría constante o, mejor aún, decreciente.
Source: Prepared with the CIEP Tax Simulator v5.
| Taxpaying population |
Revenue | (flows as a % of GDP) | Public expenditure |
Beneficiary population |
People are the beginning and the end. They are the basis and target of the tax system. It is individuals who produce public resources and who receive and benefit from them.
On the far left of the chart, households contribute taxes and public revenue. In the middle, the tax system consolidates all these funds. On the far right, implemented policies and programs redistribute resources to households and other systems.
CIEP is a not-for-profit, non-partisan civil society research center that provides accessible, relevant, and technically sound information and analyses to influence, improve and democratize discussions and decision-making in economics and public finances, with the goal of making the tax system sustainable for the benefit of current and future generations.
Go to: www.ciep.mx